Mapping human activity volumes through remote sensing imagery
My first research published in IEEE Journal of Selected Topics in Applied Earth Observations and Remote Sensing (I’m very happy, hahah), demonstrating how remote sensing imagery can be used through an end-to-end deep learning framework for reliable estimates of human activity volumes.
Contributions:
- We propose a general data-driven framework to estimate socioeconomic variables by exploring informative landscape knowledge. As the model shows great performances on measuring the human activity, it exhibits the potential for estimating the broader socioeconomic indicators at a fine-grained level.
- We provide a reliable estimator for an extensive mapping of the human activity volumes, which is especially meaningful in low income regions with sparse network infrastructures or limited access to mobile positioning data. Since the spatial scale is consistent with current census-based population products, our mappings can be useful complements to reflect averaged activity-based concentrations. This provides fundamental support for the regional sustainable development.
- We investigate the heterogeneity of landscape traces of the human activity based on hierarchical features, and we reveal how the neighbor integration improves the estimations. These shed lights on the mechanism advantages of the proposed model, and provide a new perspective to understand the interaction between human activities and physical environments.
Framework:

Fig.1. End-to-end framework of Neighbor-ResNet using RS images (denoted as Image$_1$, Image$_2$, . . . , Image$_k$) to estimate human activity volumes (denoted as $\hat{y}_1$, $\hat{y}_2$, . . . , $\hat{y}_k$). RS image tiles are resized to (3 × 128) × (3 × 128), including 128 × 128 pixels in every target (in red) and neighbor (in blue) unit. Blocks named “Conv” contain a group of convolutional layers and shortcut structures consistent with ResNet-50. We amplify a part of the convolution processes on pixels in the top circles to show integrated information (in purple) generated by algorithmic convolutions at adjacent parts of the target and neighbor tiles.
Mapping results:

Fig. 2. (Left) Spatial distributions of real values, (middle) estimated outputs of Neighbor-ResNet, and (right) ResNet in four test cities: (a) Hefei, (b) Jinan, (c) Luoyang, and (d) Shenzhen. Breakpoints of the color ramp are determined by the head/tail breaks.
Through the layer-wise feature assembling and evolving, we generally explore a potential 60.1% explainability of remotely sensed physical environments on the activity volumes. Spatial distributions of estimated outputs of Neighbor-ResNet are in better agreement with the real volumes than those of ResNet. Densely populated urban centers and city-wide spatial patterns can be clearly recognized in the estimated mappings.
Landscape Interpretation:
We conduct the interpretation from both object-based and region-based perspectives using layer-wise features. In shallow layers, distinctive ground objects provide physical clues about volume variations. We use gradient-weighted class activation mapping (Grad-CAM) to figure out ground indicators of the human activity. As summarized in Fig. 3, we find some informative objects that are commonly shared, regardless of city specialties.

Fig. 3. Grad-CAMs for object interpretations. Detailed analysis can be found in the original paper.
Through assembling image characteristics and generating high-level features, our model distinguishes subtle differences of regional layouts and reveals heterogeneous landscape traces of the human activity. Nearby classes in high indexes, which can be hard to visually identify their differences, are distinguished clearly by our model, with real volumes displaying individual distributions and their units spatially clustering in distinct urban functional contexts. You can find more detailed comparison between Beijing and Shenzhen about the heterogeneous human activity traces in different classes and different cities.
Neighbor effect:
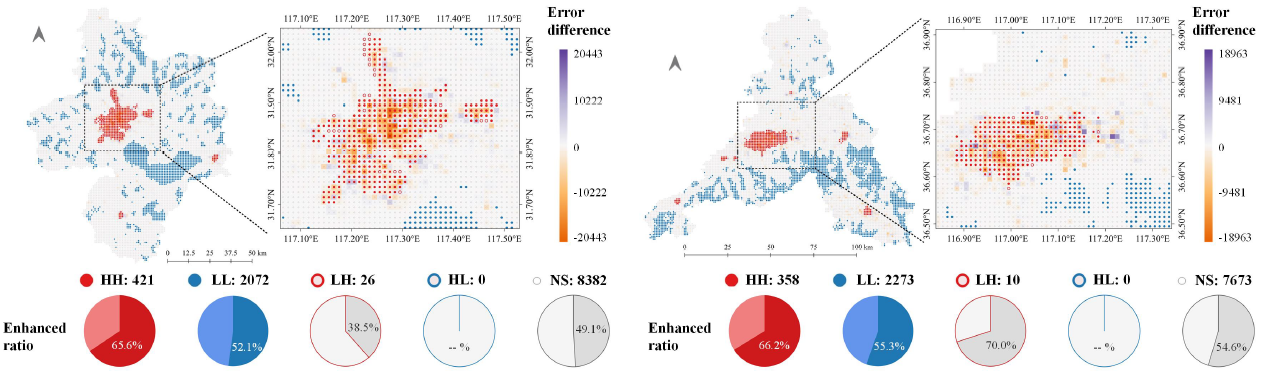
The neighbor landscape provides knowledge about geographical contexts of the target area and enhances the estimations, but its importance is inconsistent under different types of spatial associations. The result shows incorporating neighbor knowledge is more beneficial for estimating the human activity in hot spots than cold spots and nonsignificant units, while for outliers, the effect fluctuates. The result also shows that the aggregation effect of neighbors in downtown areas and dispersion effect in suburbans. These results inspire futuremodel designs by separately training groups of urban districts and suburbs to reinforce the knowledge of each single effect of neighbors.

Fig. 4. Neighbor enhancement under different spatial associations in four cities: (a) Hefei, (b) Jinan, (c) Luoyang, and (d) Shenzhen. Unit values are differences of absolute estimation errors of Neighbor-ResNet and ResNet (Error${Neighbor-ResNet}$ − Error${ResNet}$).Negative values mean accuracy improvements using Neighbor-ResNet. Five dot symbols indicate five local autocorrelation types. Pie plots annotate the ratios of units with error decrease using Neighbor-ResNet. From the results for test cities, Neighbor-ResNet generally performs better on 62.7% of hot spots, 56.9% of cold spots, and 56.5% of nonsignificant units. The enhancement on outlier units is unstable.
Summary:
Through the end-to-end model, we directly build a bridge between socioeconomic and physical environments and extract informative landscape traces of the human activity, one of the critical socioeconomic factors. This framework shows some advantages and applications:
Theoretically, it provides support to track the coevolvement of the human activity with physical landscape through hierarchical RS features; the model enhancement validates the feasibility of integrating the geographical laws into networks; and the great predictability reminds us to consider the collinearity of activity-related indices and environmental factors when they are both used as explanatory variables in related tasks.
Practically, it provides a universal architecture supporting a wide range of socioeconomic measurements, such as gross domestic product (GDP), crime rates, and housing prices; it can be a reliable human activity estimator with great generalizing performances on extensive unsampled areas, especially in lowincome countries and regions; and the estimated values provide a basic magnitude reference to adjust diverse activity data from different mobile sources, and thus, make them comparable.With the advantages of the generalizability of the DCNN and scale invariance of convolutions, future model improvement can be achieved by enriching input features about region specialties and utilizing adaptive strategies for scale selections and neighbor extensions.